Whatever you trade, the news moves it. Know how much — and what it costs.
Impact is an economic calendar that keeps the price reaction to every release it tracks: how far each instrument moved, second by second, and what the spread did at the moment the number printed. Across FX, metals, oil, indices and crypto.
Free account, no card · 30-day money-back guarantee · cancel anytime
For professional traders
What a professional trader needs from an economic calendar
Any economic calendar gives you the time, forecast, actual and prior. For a professional trader, the calendar worth paying for also records what each release did: the size of the surprise, how far each instrument moved, and what the spread cost at that moment. Impact is built around those three, as a record of what happened, not a live feed.
| What to look for | What Impact records, per release |
|---|---|
| The surprise | Deviation from forecast, on the headline and the revision |
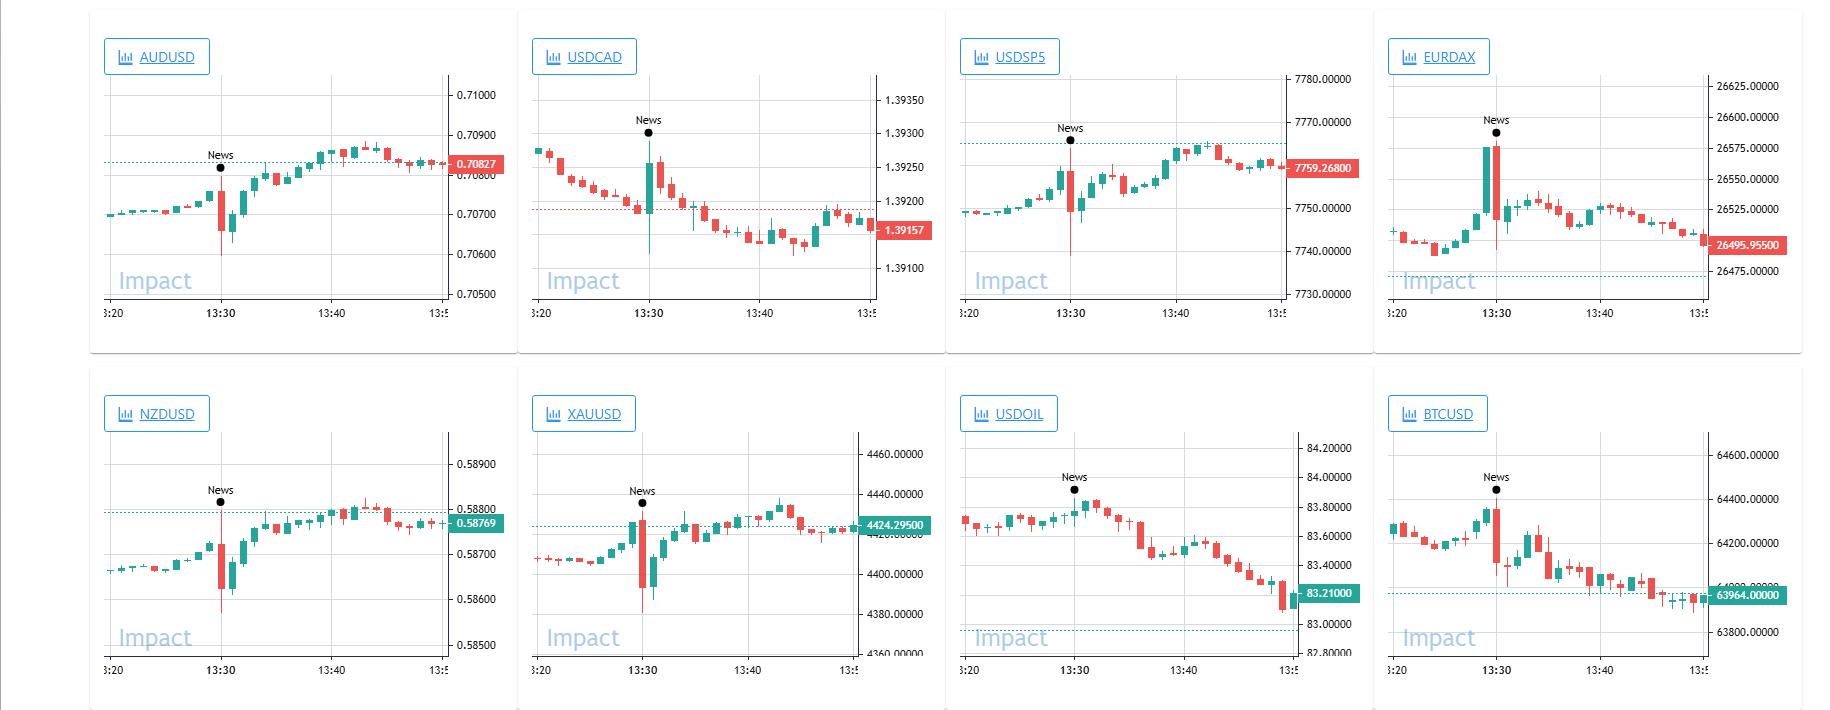
| The reaction | A chart per instrument, down to one second; the move at six horizons |
| The cost to trade | Normal spread against the spread measured live at news time |
| Breadth | FX, metals, oil, indices, crypto: 793 instruments |
| History | Every past occurrence; 97,428 releases back to 2001 |
| Delivery | Each release timestamped on arrival at our systems |
| Timing | Post-event: charts about ten minutes after the print |
Why the spread matters: measured at US CPI, Nonfarm Payrolls and Fed decisions
From March 2021 to September 2026, the typical connected broker account's widest spread in the half-minute around these releases was:
| Pair | Normal spread | At news time, median release | 1 release in 10 |
|---|---|---|---|
| EURUSD | 2.1 | 5.0 | 8.0–8.6 |
| GBPUSD | 2.3 | 7.0–8.0 | 13.0–13.7 |
| USDJPY | 2.7 | 8.0–10.0 | 13.0–15.0 |
All figures in pips. Ranges run from the lowest to the highest of the three releases. News-time figures are the widest spread each connected account showed from about 5 seconds before to about 25 seconds after the release; “typical” is the middle account. Normal spread is Impact's panel median at 25 September 2026, a separate measurement. Other data often prints in the same second, so each figure describes the market at that moment, not one release in isolation. Full method and per-release breakdown: how wide forex spreads get during high-impact news.
When Impact is not the right tool: if you need live headlines or a streaming feed while a release prints, Impact is not that. It is the measured record of what each release did, for checking before you hold risk through the next one. It gives no trading advice.
Price reaction, release by release
An economic calendar with the price reaction to each release
Impact is an economic calendar that records what each release did to the market: a chart for every instrument it moved, marked at the release time, and the spread at news time next to the normal spread. Open any release and you can see every past occurrence of the same release.
| For each release it tracks | Impact shows |
|---|---|
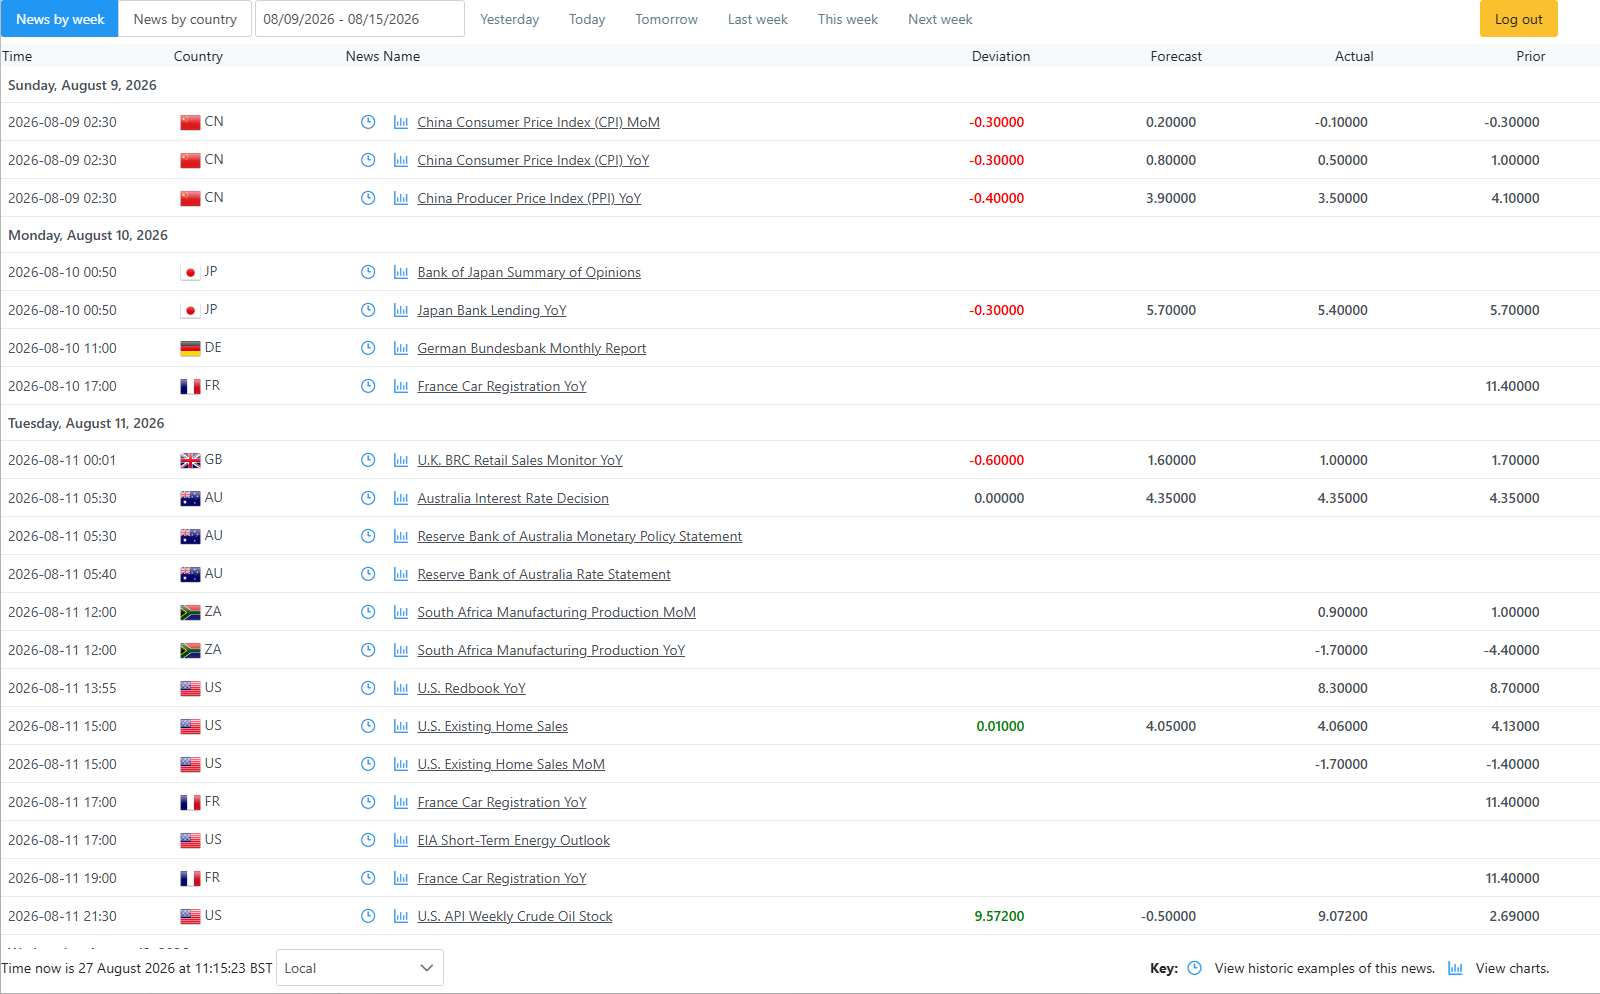
| The number | Forecast, actual, prior and revision, with the deviation calculated |
| The price reaction | A chart per affected instrument, down to one-second resolution, and the move in pips at six horizons |
| The cost of trading it | Normal spread against the spread measured live at news time |
| The history | Every past occurrence of the same release. Release data goes back to 2001; reaction-chart depth varies by instrument |
What that record looks like: US CPI, March 2021 to September 2026
Over the last 11 US CPI releases (October 2025 to September 2026), gold's biggest move inside the release minute was typically about $31 an ounce, and reached $59 in July 2026. Across all releases since March 2021:
| Measure, at US CPI | Releases | Typical release | 1 release in 10 |
|---|---|---|---|
| Gold: biggest move in the release minute | 66 | 0.39% of price | 0.89% |
| Gold: high–low range, first 15 minutes | 66 | 0.78% | 1.32% |
| EURUSD: spread at news time, typical account | 58 | 5.0 pips | 8.4 pips |
| EURUSD: normal spread, for comparison | – | 2.1 pips | – |
How it was measured. Gold: one-minute XAU/USD bid prices from Impact's price feed, the same data as Impact's charts, around every US CPI release from the Bureau of Labor Statistics archive. EURUSD: the widest spread each connected broker account showed from about 5 seconds before to about 25 seconds after the release; “typical account” is the middle one. Normal spread is Impact's panel median at 25 September 2026. Other US data is often published at the same 8:30 New York time, so each figure describes the market at that moment, not CPI in isolation. Full method: gold after US CPI and spreads at news time.
Impact reports what happened. It gives no trading advice, and past moves say nothing certain about the next release.
The problem
The calendar tells you the number. It doesn't tell you what it did to your book.
Every calendar shows you that CPI is at 13:30 and what the forecast is. None of them tell you how far your instrument actually moved when it printed, how long the move lasted, or what your spread looked like at that exact second — which is often the difference between a trade that works and one that doesn't.
If you hold risk through economic releases — and almost everyone does, whether they trade the news or not — that's the information you're missing.
What nobody else shows you
What the spread did at the moment it printed
Impact records normal spreads continuously across a panel of hundreds of brokers, and measures the spread live at the moment each release prints, so for any release you can compare the normal spread against the spread at news time. A move you can't afford to trade isn't an opportunity.
| Instrument | Normal spread (median) | At news time (median) | Change |
|---|---|---|---|
| EURUSD | 2 | 6 | 3.0× |
| USDJPY | 3 | 11 | 3.7× |
| GBPUSD | 3 | 8 | 2.7× |
| XAUUSD (gold) | 18 | 100 | 5.6× |
| US 30 index | 10 | 125 | 12.5× |
| BTCUSD | 247 | 5,401 | 21.9× |
Spread at news time is what was observed at the US Consumer Price Index release of 12 August 2026 13:30 UK — that figure is fixed. Normal spread is the rolling median across the panel of hundreds of brokers, so it moves as more is observed; these were read on 28 August 2026. Real figures from the product — not an illustration.

Five years of it, measured: how wide spreads get at US CPI, Nonfarm Payrolls and Fed decisions →
What you get
Three things, for every release we track
The move, second by second
A chart per affected instrument, marked at the exact release time, down to one-second resolution — plus tick-level bid and ask when you need to see inside the move.
The cost of trading it
Normal spread from a panel of hundreds of brokers against the spread measured at news time, with the share of accounts trading at or below the median. The honest answer to whether a release was tradeable.
The size of the surprise
Forecast, actual, prior and revision — with the deviation calculated for you, on both the headline figure and the revision. The surprise is what moves the market.

Five years of it, measured: how much gold moves after the US CPI release →
Coverage
Not just FX
A single US CPI release renders around thirty instruments. Economic data moves everything, so Impact measures everything it moves.
- FX majors and crosses — plus a deep exotics book: TRY, ZAR, MXN, PLN, SEK, NOK, CZK, HUF, SGD, CNH
- Indices — US 30, US 500, DAX and more
- Metals — gold and silver
- Energy — oil
- Crypto — BTC and ETH, which now react to US macro like everything else
1,773 event types, 22 countries
From Non-Farm Payrolls and CPI to rate decisions, PMIs, inventories and regional releases — roughly twenty a day, scheduled ahead and measured afterwards.
Every release is timestamped against when the data actually reached us, so you can see the delivery latency rather than take it on trust.
Who it's for
Professional traders who carry risk through events
Discretionary traders
Know what's coming, how far it typically moves your instrument, and whether the spread makes it worth touching.
Systematic and quant desks
Event-aware sizing and blackout windows, built on measured reaction distributions rather than assumptions.
Prop-firm traders
Drawdown limits make event risk existential. Being caught by a release you didn't know was coming can end an account.
Execution and risk
Spread at news time, set against a normal-spread panel of hundreds of brokers, is a cost-of-trading and best-execution question, measured rather than estimated.
How the data is built
Measured, not modelled
Price data comes from an institutional feed and is stored at tick and second resolution. Spread data is recorded continuously by our own software across a panel of hundreds of brokers. Release figures are collected from primary calendars and timestamped on arrival.
Impact is a post-event analysis tool, not a live feed. Charts for a release become available roughly ten minutes after it prints, and the data is historical rather than streaming. We would rather tell you that up front than have you find out after you've paid.
Impact reports what happened. It does not tell you what to trade, offer recommendations, or make any claim about returns.
Mobile
The release, and what it cost, in your pocket
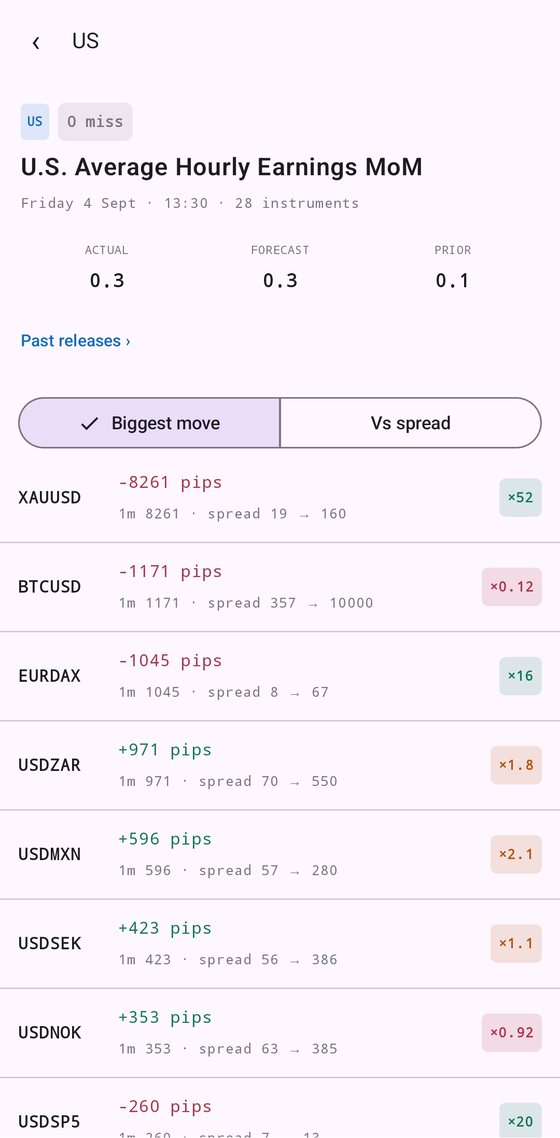
The Impact app carries the same measurement as the desktop product, ranked for a phone screen: every release of the day, the instruments it moved most, and how many times wider the spread went at the moment it printed.
- Today’s calendar, filtered to the releases that can surprise
- Move and spread blow-out side by side, instrument by instrument
- Charts down to two seconds, with the release marked
- Every past occurrence of the same release
- Push alerts for the releases you follow
- A home-screen widget — a live countdown to the next release, and everything else that prints at the same moment. How to add the widget
Free to download, and one Impact account covers both — sign in on the app with the same login you use here. The full reaction charts and the spread panel of hundreds of brokers still want a desktop screen; the app is what you carry between them.
Pricing
One plan, everything included
Billed monthly. Cancel any time.
- Every release, back to 2001 — 97,428 and counting
- All 793 instruments across five asset classes
- Second-level and tick-level reaction charts
- Normal spreads from hundreds of brokers vs spreads measured at news time
- Deviation on headline and revision figures
- Data-delivery timestamps
- Full charting with deep-linking and sharing
Questions
Before you sign up
What should a professional trader look for in an economic calendar?
Look for one that records what each release did, not only when it printed: the deviation from forecast, how far each instrument moved, and the spread at news time against the normal spread. Impact is built for that, across FX, metals, oil, indices and crypto, with releases back to 2001. It is a post-event record, not a live feed, and it gives no trading advice. What Impact records, per release.
Is this a live feed?
No. Impact is a post-event analysis tool. Charts for a release become available about ten minutes after it prints. If you need sub-second live execution data, this isn't that product.
Does Impact show the historical price reaction for each release?
Yes. For every release it tracks, Impact keeps a chart per affected instrument marked at the release time, the move in pips at six horizons, and the spread at news time next to the normal spread, and you can open every past occurrence of the same release. Release data goes back to 2001; reaction-chart depth varies by instrument.
Do you tell me what to trade?
No. Impact measures and reports what happened — price moves and spread costs. It gives no recommendations, signals or advice, and makes no claims about returns. What you do with the data is entirely your decision.
Where does the spread data come from?
Our own software records spreads continuously across a panel of hundreds of brokers, and "normal spread" is the observed median across that panel. "Spread at news time" is measured live, second by second, on the broker accounts our software is connected to at the moment the number prints, so it shows what an account could actually trade at in that moment.
How far back does the history go?
Release data goes back to 2001, covering 97,428 releases across 1,773 event types and 22 countries. Reaction chart depth varies by instrument.
Is there a free version?
Yes. A free account gives you the current day's calendar and the instruments reacting to it, with no card and no time limit. Past releases, the instrument detail and price alerts come with the subscription, at €249 per user per month including VAT, billed monthly, cancellable at any time. You're also covered by a 30-day money-back guarantee after your first payment.
Does it work on a phone?
Yes — there is an Impact app, on both. Impact Economic Calendar is on Google Play for Android and on the App Store for iPhone. The app gives you the day's releases, what each one moved and what the spread did, plus charts down to two seconds and push alerts.
The website itself is built for desktop — the full reaction-chart grid and the spread panel need the screen space, and it's best used at 1920×1080 or similar.
Who is behind Impact?
Impact is operated by Dostum Amigo SL, a company registered in Spain. The underlying market data infrastructure has been run for over a decade by a specialist FX technology team.
See what the last release did to your instruments.
Free to start. No commitment, and a 30-day money-back guarantee if you do subscribe.
Create your free account